Best AI-Powered Data Visualization Tools in 2025
November 29, 2024

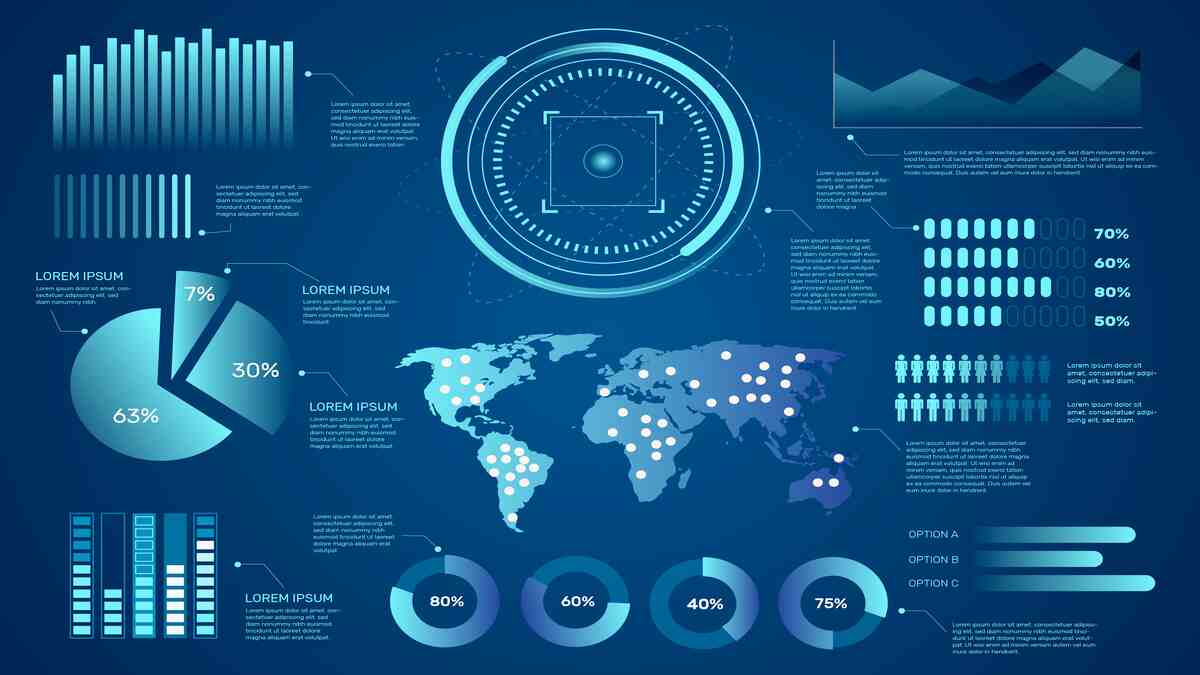
Data visualization is the art and science of presenting data visually to make it easier to understand and interpret. With data’s increasing volume and complexity, traditional data visualization tools often need to catch up. This is where AI-powered data visualization comes into play. By leveraging advanced algorithms and machine learning techniques, AI can transform raw data into compelling and insightful visualizations.
By using Lead generation software and AI-powered data visualization tools, businesses can gain valuable insights into their target audience and create more effective marketing campaigns. This can help them generate more leads and convert them into customers.
Data visualization is the process of taking data and presenting it visually. This could be in the form of charts, graphs, maps, or other visual representations. The goal is to make complex data more accessible and understandable.
AI-powered data visualization leverages advanced algorithms and machine learning techniques to automate and enhance the data visualization process. Here’s a detailed breakdown of how it works:
AI systems can automatically gather data from diverse sources, such as databases, spreadsheets, APIs, and real-time data streams. This eliminates manual data collection efforts and ensures a continuous flow of up-to-date information.
AI algorithms can identify and correct errors, inconsistencies, and missing values in the data.
AI can normalize data to a common scale, making it suitable for analysis and visualization.
AI can detect and handle outliers, which can significantly impact visualization accuracy.
AI can automatically extract relevant features from raw data, such as trends, patterns, and anomalies.
AI can select the most informative features for visualization, reducing noise and improving clarity.
AI can create new features by combining or transforming existing ones, enhancing the data’s insights.
AI can automatically select the most appropriate visualization technique (e.g., bar charts, line charts, scatter plots, heatmaps) based on the data type and the insights to be conveyed.
AI can create interactive visualizations that allow users to explore data at different levels of detail and from various perspectives.
AI can tailor visualizations to user preferences and requirements, enhancing the user experience.
AI can identify complex patterns and trends within the data that may not be apparent to human analysts.
AI can flag unusual data points or deviations from normal behavior, enabling timely investigation and response.
AI can forecast future trends and outcomes based on historical data and current patterns.
AI has revolutionized the field of data visualization, empowering organizations to extract valuable insights from complex data. Here are some key ways in which AI is transforming data visualization:
AI algorithms can automatically identify patterns, trends, and anomalies within large datasets, saving analysts significant time and effort.
AI can forecast future trends and outcomes based on historical data, enabling proactive decision-making.
AI-powered visualizations can be interactive, allowing users to explore data dynamically by zooming, filtering, and drilling down.
AI can create personalized dashboards tailored to specific user needs, providing a more efficient and effective data exploration experience.
AI-driven data visualization can provide clear and actionable insights that inform strategic decision-making.
AI can help organizations mitigate risks and capitalize on new opportunities by identifying potential risks and opportunities.
AI can create user-friendly interfaces that make complex data accessible to a wider audience, including non-technical users.
AI-powered natural language processing can enable users to interact with data using natural language queries, further democratizing data access.
AI algorithms can be trained to mitigate biases in data and visualizations, ensuring fair and equitable representation.
AI-powered data visualization tools can be designed to protect sensitive data and comply with privacy regulations.
To effectively implement AI in data visualization, consider the following best practices:
Clearly articulate the specific goals and objectives of your data visualization project.
Consider the technical expertise of your target audience and tailor the visualizations accordingly.
Ensure data accuracy by removing inconsistencies, outliers, and missing values.
Combine data from various sources to create a comprehensive dataset.
Transform data into a suitable format for visualization, such as numerical or categorical data.
Design intuitive and user-friendly interfaces that are easy to navigate.
Choose appropriate visualization techniques that convey insights, such as charts, graphs, and maps.
Allow users to explore data dynamically by zooming, filtering, and drilling down.
Ensure compliance with data privacy regulations and protect sensitive information.
Be mindful of potential biases in data and algorithms, and take steps to mitigate them.
Communicate the limitations and assumptions of AI-powered visualizations.
Continuously refine and improve visualizations based on user feedback and evolving data.
Regularly retrain AI models to adapt to changing data patterns and trends.
Monitor the performance of AI-powered visualizations and identify areas for optimization.
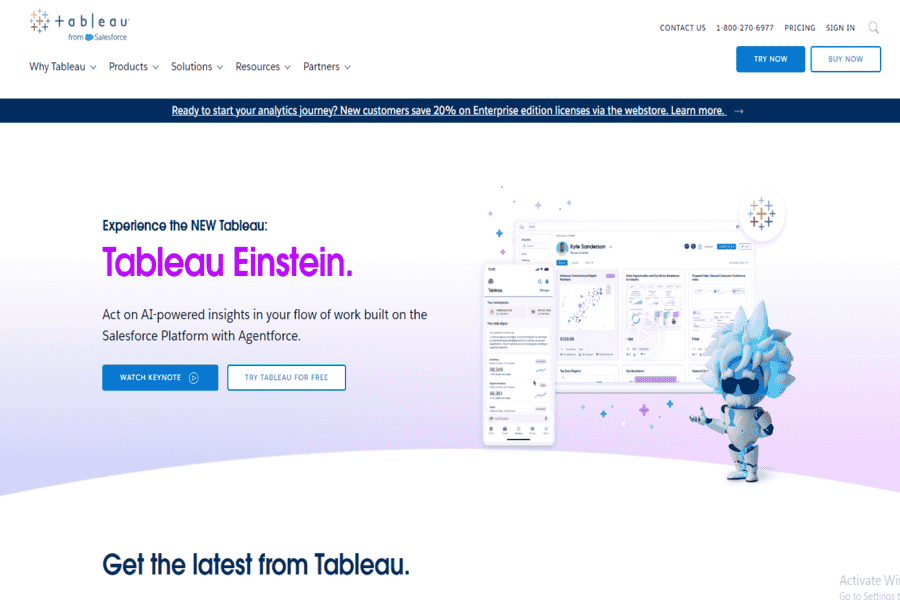
Tableau is a leading data visualization platform with AI features for predictive analytics and natural language processing (NLP). It allows users to create dynamic dashboards and gain insights without deep technical expertise.
Microsoft Power BI is an AI-driven data visualization tool that integrates seamlessly with Microsoft products. It offers advanced analytics and interactive visualizations for businesses of all sizes.
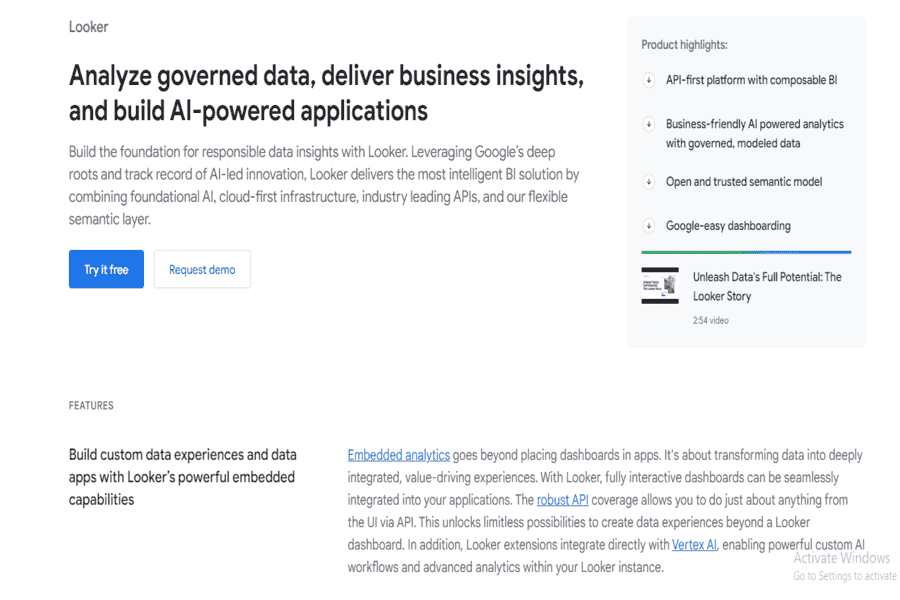
Google Looker is an enterprise-grade BI platform that leverages AI to offer advanced analytics and tailored data visualization solutions. It’s designed for in-depth data exploration.
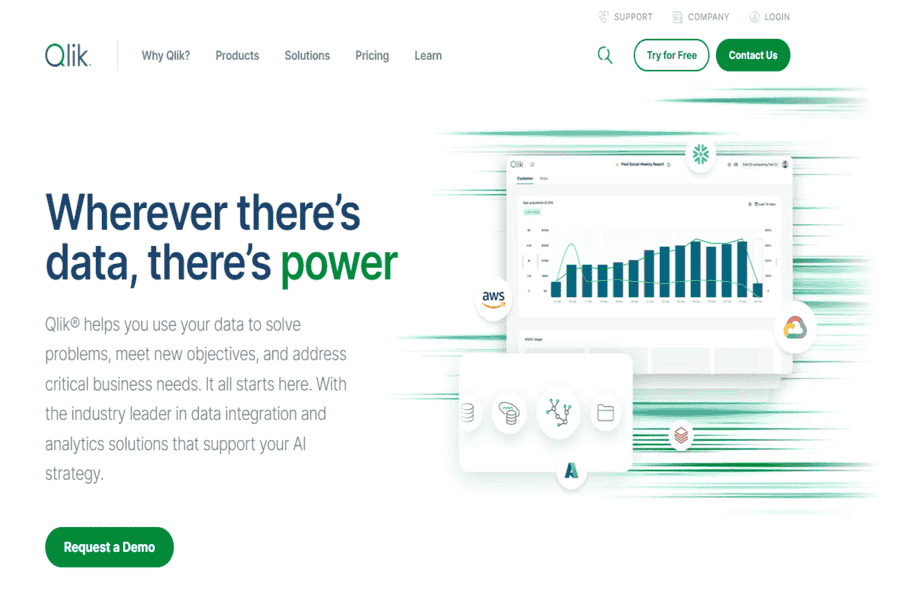
Qlik Sense uses AI and machine learning to provide guided analytics and advanced visualizations. It enables users to discover data patterns and insights with ease.
IBM Cognos Analytics combines AI with data visualization to offer automated insights and custom dashboards. It is suitable for businesses looking for in-depth analytics and forecasting.
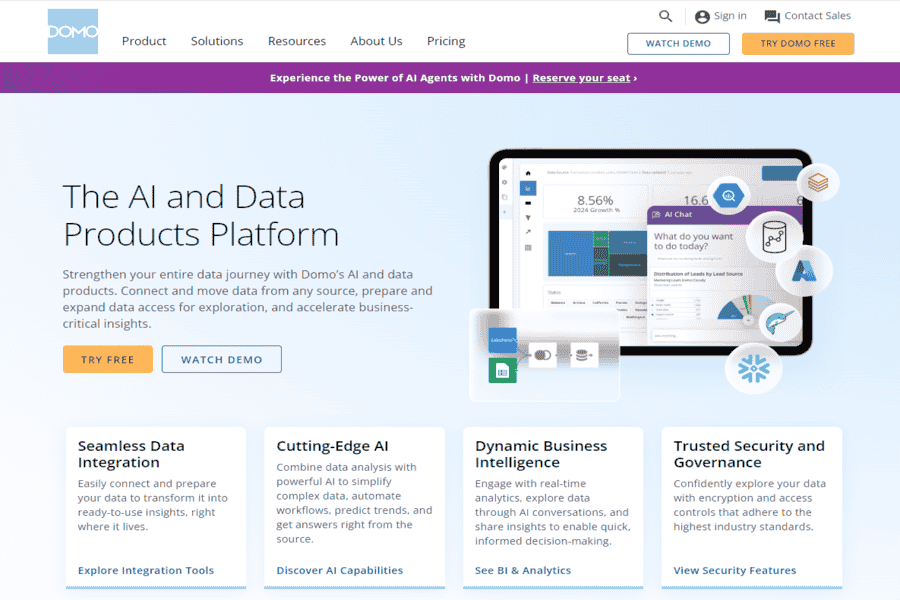
Domo is a cloud-based business intelligence platform that uses AI for advanced data visualization and real-time analytics. It’s designed for collaborative decision-making in organizations.
Sisense provides AI-powered analytics and interactive data visualization tools. It is designed to simplify complex data for better decision-making.
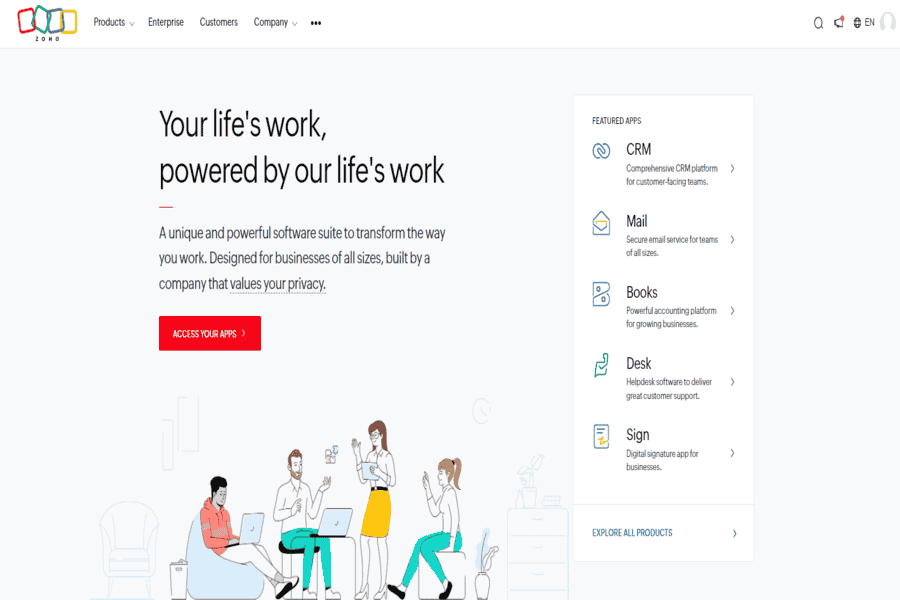
Zoho Analytics is a cost-effective BI tool with AI-driven data visualization capabilities. It offers charts, graphs, and reporting features suitable for small to medium businesses.
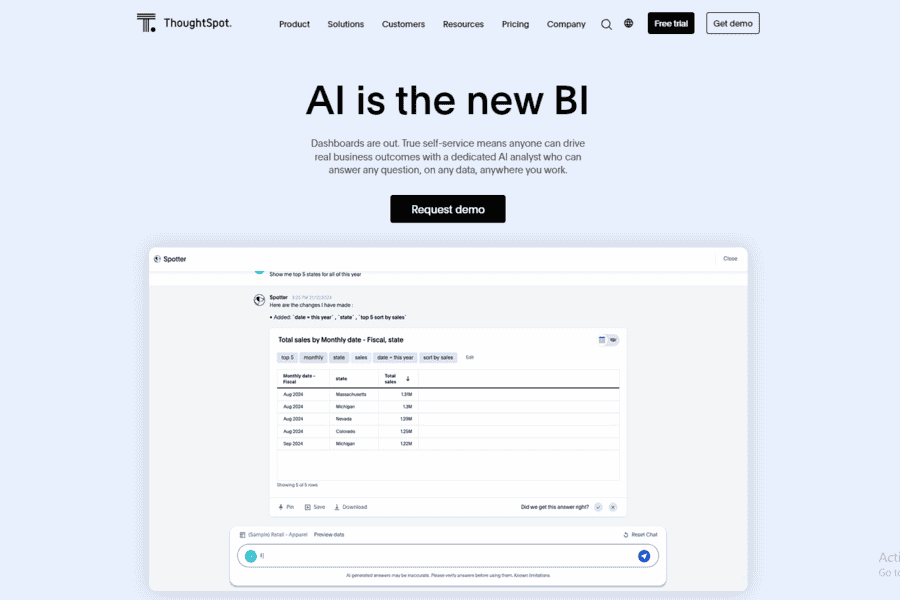
ThoughtSpot leverages AI to enable search-based analytics, allowing users to ask questions and get instant visualizations. It’s ideal for businesses seeking self-service BI solutions.
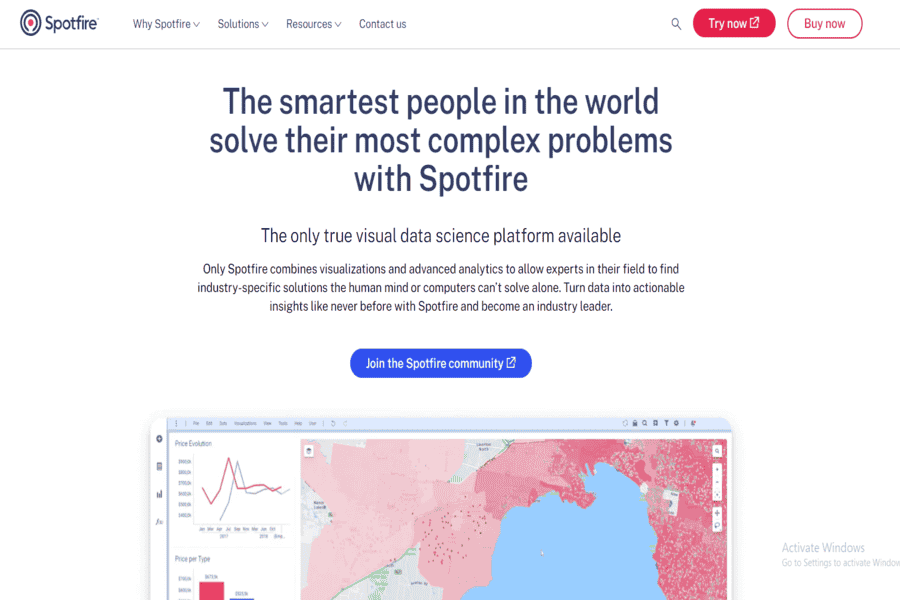
TIBCO Spotfire combines AI with advanced analytics for real-time data visualization. It offers a powerful platform for predictive and prescriptive analytics.
Chartio provides cloud-based data visualization with AI-driven insights. It is known for its simplicity and ability to integrate data from various sources seamlessly.

Altair SmartWorks is a platform combining AI, IoT, and data visualization for actionable insights. It’s designed for industries dealing with large and complex datasets.
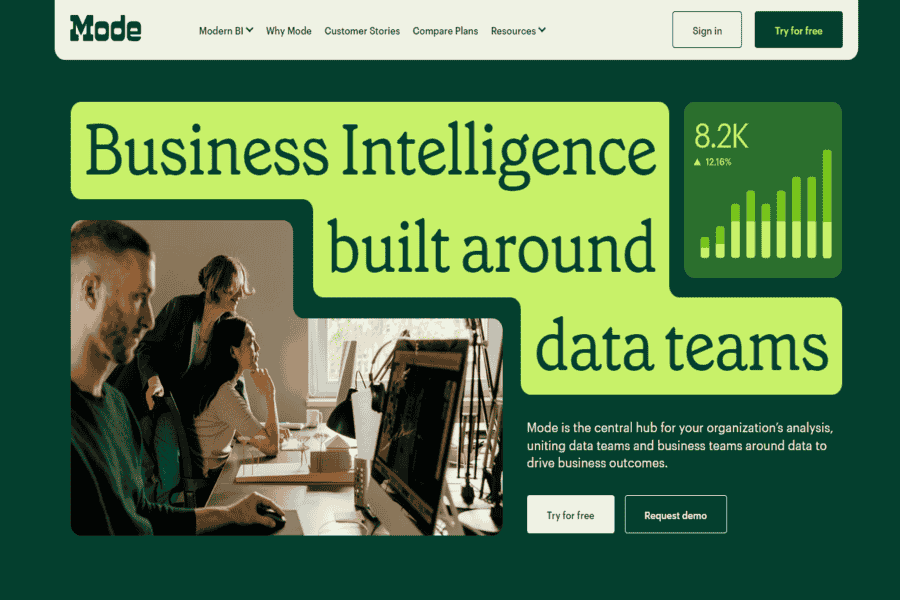
Mode Analytics integrates AI and SQL to deliver advanced data visualization. It’s designed for data scientists and analysts who require detailed insights and visual reports.
DataRobot combines AI and machine learning with data visualization tools to provide predictive analytics. It’s tailored for businesses seeking automated insights and decision-making tools.
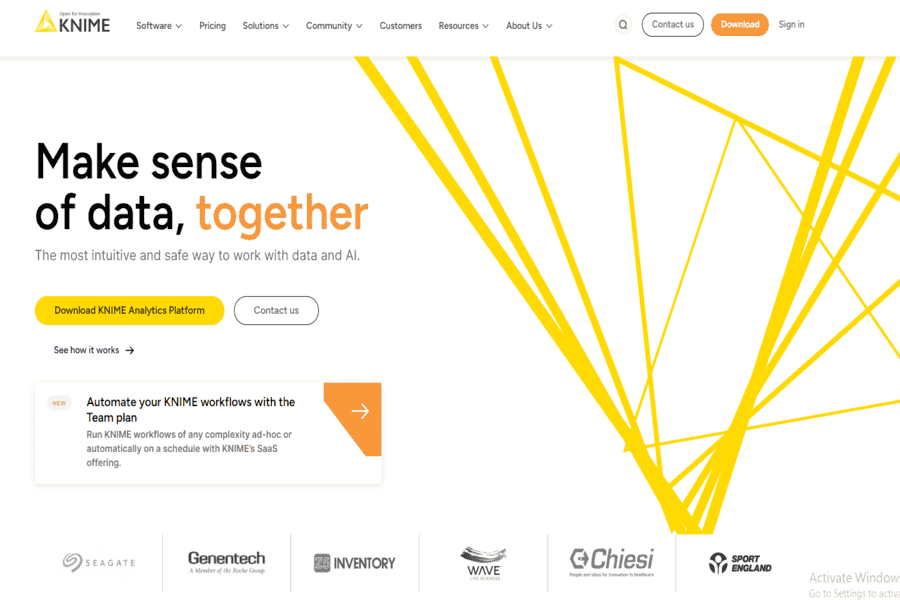
KNIME Analytics Platform is an open-source data visualization tool with AI capabilities. It provides advanced analytics and machine learning integration for businesses of all sizes.
While AI offers significant benefits, there are several challenges associated with its implementation in data visualization:
Ensuring data accuracy, consistency, and completeness is crucial for reliable visualizations.
Integrating data from multiple sources can be complex and requires careful data cleaning and transformation.
Some AI models, such as deep neural networks, can be difficult to interpret, making it challenging to understand the underlying reasoning behind their predictions.
AI models can inherit biases from the data they are trained on, leading to biased visualizations.
Protecting sensitive data’s privacy and security is crucial, especially when dealing with personal or confidential information.
AI-powered visualizations should be designed to avoid bias and promote fairness.
Being transparent about AI-powered visualizations’ limitations and potential biases is important.
Implementing AI-powered data visualization requires specialized skills and expertise in data science, machine learning, and visualization techniques.
Organizations need access to powerful computing resources and appropriate software tools to support AI-powered data visualization.
The future of AI-powered data visualization is promising, with several exciting trends emerging:
AI-powered dashboards will enable real-time monitoring and analysis of data streams.
Users can interact with visualizations to explore data at different levels of detail.
AR and VR will provide immersive experiences for exploring complex datasets.
3D visualizations, such as geographic information or product design, can represent spatial data.
AI models will become more transparent, allowing users to understand the reasoning behind the insights generated.
Explainable AI can help build trust in AI-powered data visualization tools.
Users can ask questions in natural language to get specific insights from data.
AI can automatically generate reports based on data analysis and visualization.
AI algorithms will be developed to minimize bias in data and visualization.
AI-powered tools will prioritize data privacy and security.
AI-powered data visualization is transforming the way we understand and utilize data. By automating complex tasks, generating insightful visualizations, and enabling real-time analysis, AI empowers organizations to make data-driven decisions faster and more accurately. As AI continues evolving, we can expect even more innovative and powerful data visualization tools to revolutionize our work and live.
